Riley's tree cricket
Oecanthus rileyi
Relative to Temperature (°C)
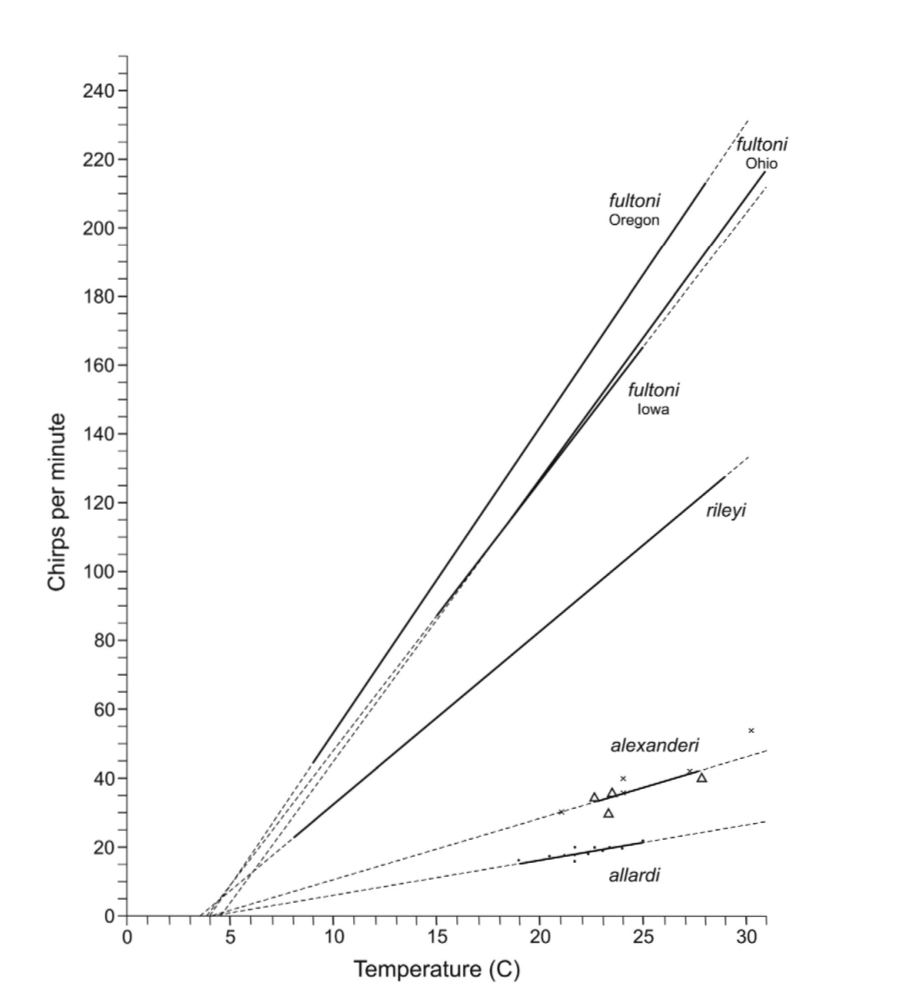
Species within the Oecanthus rileyi group have calling songs composed of chirps or brief trills that are easily countable and exhibit highly regular rates that vary linearly with temperature. The above graph shows the trend lines for O. fultoni (Oregon, Ohio, and Iowa), O. rileyi, O. alexanderi, and O. allardi. Solid portions of the lines represent data points; dotted lines indicate extrapolated values. The extrapolated regression lines tend to converge at 4 °C, where the chirp rate is expected to be zero. Based on this relationship, simple formulas can be calculated that convert chirp counts into highly accurate estimates of ambient temperature. The formula provides a time interval (in seconds) for counting the number of chirps heard from a singing cricket, which is then added to a number that offsets the temperature range where y = 0.
The formulas for °C and °F for O. rileyi are:
How to Calculate Tree Cricket Temperature Formulas
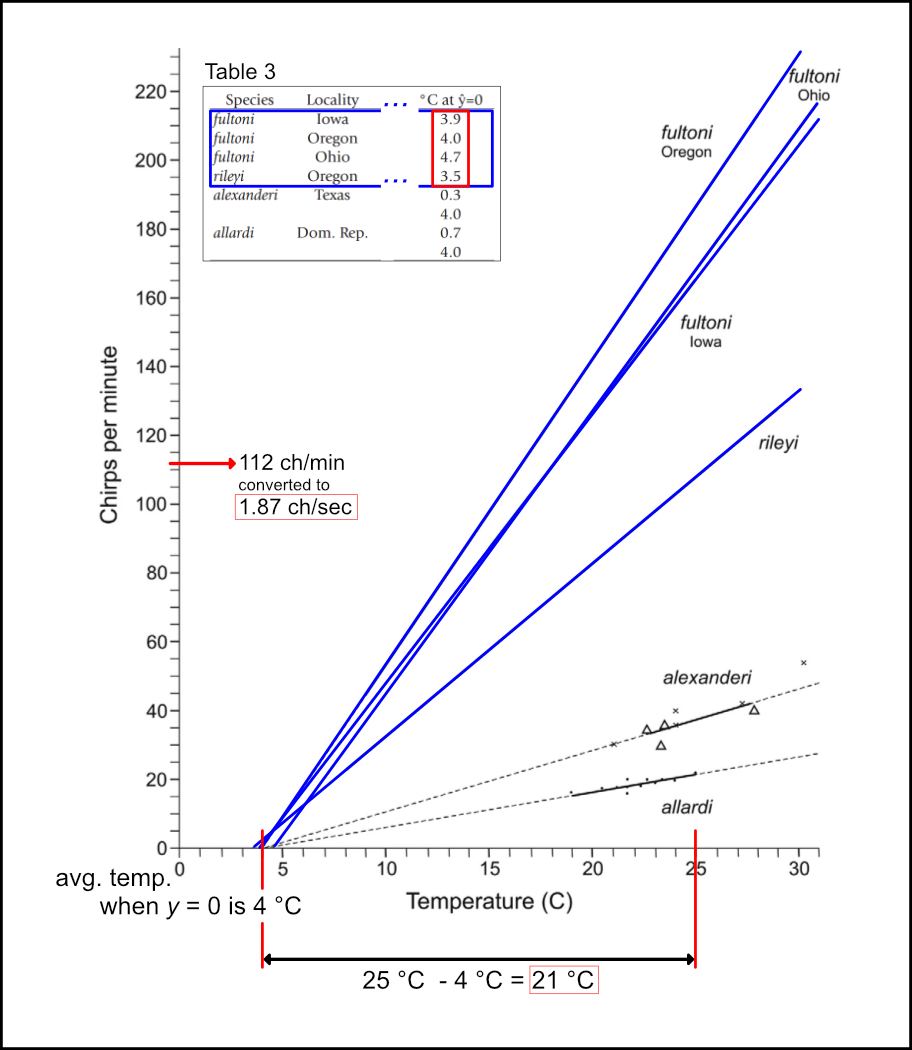
Here is an example using a data set for O. rileyi with 112 chirps per minute at 25 °C (77 °F).
The time interval for counting chirps is equal to the reciprocal of the slope for a given species. Because the count time is given in seconds (which provides a practical measurement), the chirp rate should be expressed in seconds. Therefore, the first step is to convert chirps per minute to chirps per second. For our example:
The number of chirps per second represents the numerator of the slope. The denominator is the span of degrees in relation to the number of chirps per second.
The denominator of the slope is the span of degrees between the temperature where y = 0 and the temperature associated with the chirp rate being considered (1.87 chirps per second at 25 °C). The temperature at y = 0 that is used in the formula is the average of the four blue regression lines shown in the above graph. These lines are for O. fultoni (Iowa, Oregon, and Ohio) and O. rileyi and the average temperature is 4 °C (39 °F). The degree span is calculated by subtracting the temperature at y = 0 from the upper temperature.
For °Celsius:
For °Fahrenheit:
To determine the slope of the regression line, divide the chirp rate by the degree span.
For °Celsius:
For °Fahrenheit:
The count time is the reciprocal of the slope.
For °Celsius:
For °Fahrenheit:
Add the average temperature when y = 0 (which was subtracted when calculating the degree span) to the count time to get the estimated temperature. These are the final formulas:
Example
Below is an audio file of O. rileyi singing for 11 seconds. Count the number of chirps.
There are 15 chirps. Use the formula to calculate temperature in °C.
Is this correct?
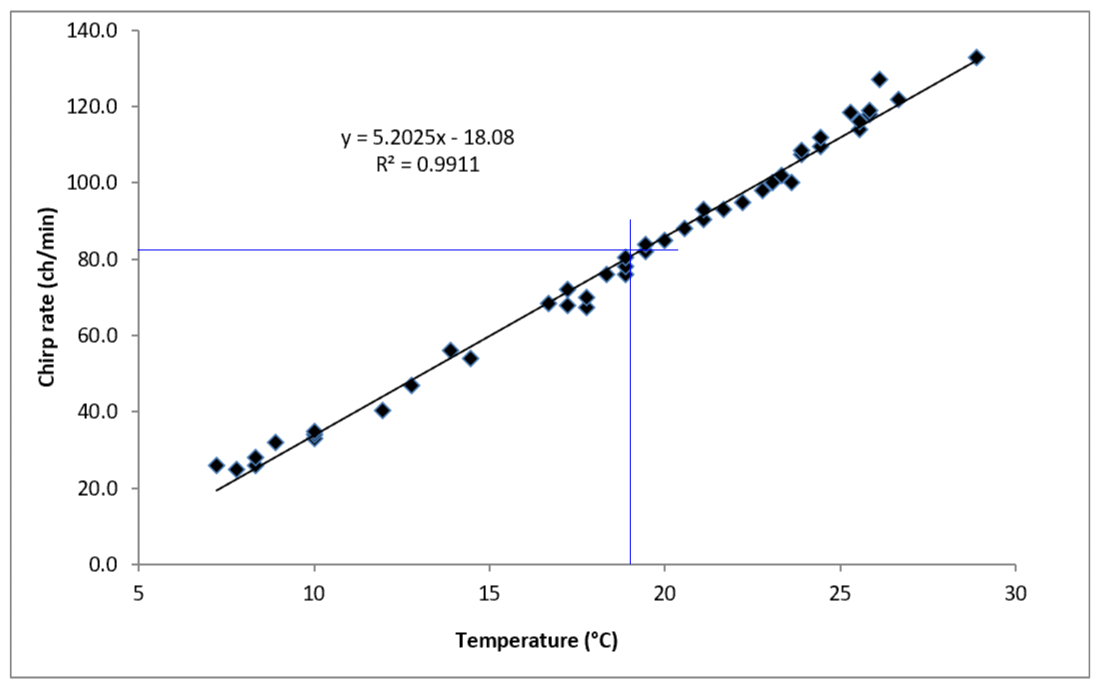
Convert the chirps per second to chirps per minute and compare the results to the graph showing the trend line for O. rileyi.
On the graph for O. rileyi, draw a vertical line from 19 °C on the x-axis to meet the trend line. Then draw a horizontal line from 81.8 chirps per minute on the y-axis to the trend line. The two lines do not cross exactly on the trend line, but they are close enough to be a good estimate.

Data points (Walker and Collins 2010, supplemental content) around 19 °C are:
| Temperature °C | Chirps/minute |
| 18.89 | 76.0 |
| 18.89 | 78.0 |
| 18.89 | 80.5 |
| 19.44 | 82.0 | 19.44 | 84.0 | average chirp rate: | 80.1 |
The song used in this example was recorded by J. Banas in Bernalillo County, New Mexico at the recorded temperature of 19 °C. The audio for this song is on O. rileyi's species page with a duration of 16 seconds. The audio was trimmed to 11 seconds for this example. The graph, data, and field measurements align with the temperature calculated using the tree cricket formula for estimating temperature based on chirp rate. Therefore, we can conclude that the temperature calculated using the formula is a good approximation of the actual temperature.


