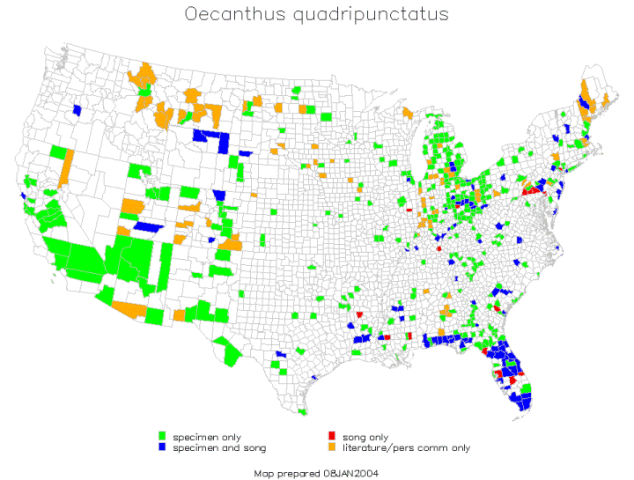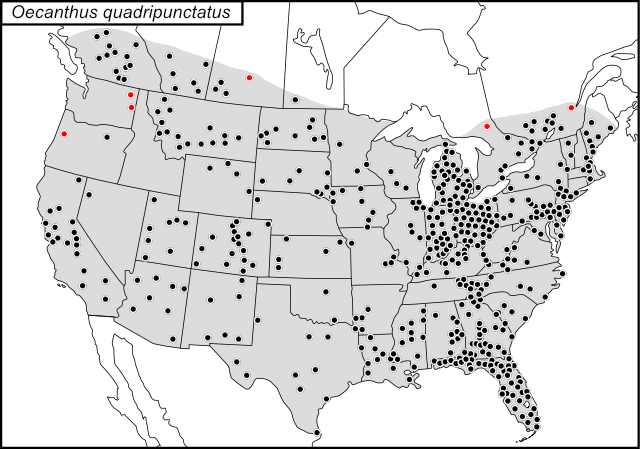


Both types of maps are made from the same records except those for species with abundant Ohio records from the field notes of E. S. Thomas and R. D. Alexander. For these species, many of the Ohio records on the dot maps do not show on the computer-generated maps, because only a representative sample of these records were entered into the Access database.
2021 Addendum to this page: The Access database that made computer-generated maps possible was established in 1998 and named “GrylTett.” The last year that computer-generated maps were made from the database and added to the map pages of SINA was 2004.
Advantages
Each county record gets the same sized dot, making records for even the smallest counties plainly visible.
For counties that are large or extended, the dot can be placed at the appropriate place within the county and more than one dot can be used. For example, in Monroe County, Florida, occurrence is separately indicated for Lower Florida Keys, Upper Florida Keys, and continental Monroe County.
Disadvantages
Dots must be manually placed, which is time consuming and subject to error.
Where records are dense and the dots are bigger than the counties, dots must be overlapped or omitted.
Advantages
All U. S. records in the Access database can be mapped quickly and with total accuracy.
Disadvantages
The program that makes the computer-generated maps can make no use of Canadian records.
Records for unusually small counties may not be visible at the scale that is used for maps in SINA (for example, some of the counties on the upper Atlantic coast are that small).
Many of the counties in the West are too large to display distribution at as fine a scale as revealed by county-level mapping in the East.

|

|
Note 1. These two maps for the four-spotted tree cricket illustrate the advantages and disadvantages described above for computer-generated and dot maps.
The computer-generated map was made in 2004, while the dot map was made in 2021. The six red dots indicate records as recent as 4 September 2020. Thus it becomes obvious that a major disadvantage of the computer-generated map is that it cannot be updated.
Note 2. The last computer-generated maps were made in 2004. Since that year ca. 58 species have been added to SINA, which means that only dot maps are available for these species.